Pipmed Medical Pipmed Medical

7 Best Factors That Influence Imaging Performance?

Time:2026-09-21 Author:Isabella
0%

Imaging performance is rarely determined by one impressive specification. A sharp lens can still produce a weak image when lighting, focus, or sensor quality falls short. This is why understanding what factors influence imaging performance matters across medical, industrial, scientific, and consumer applications.

David Marr, a respected computer vision researcher, wrote, “Vision is the process of discovering from images what is present in the world, and where it is.” His observation remains relevant. Imaging systems must capture useful information, not merely attractive pixels. Resolution, lens quality, sensor sensitivity, illumination, focus accuracy, image processing, and environmental stability all shape the final result. Each factor leaves visible evidence. Fine edges may blur. Dark areas may lose detail. Moving subjects may show distortion. Heat can also shift calibration.

Real-world testing often reveals more than a product datasheet. A camera may perform well under bright laboratory lights, then struggle beside a reflective metal surface. That matters.

This guide examines seven key factors that influence imaging performance. It connects technical specifications with practical outcomes, including sharpness, contrast, color accuracy, noise, dynamic range, and consistency. Some factors overlap. Some depend on the application. A conclusion that works for surveillance may fail in microscopy. That limitation deserves attention.

The discussion also considers measurement methods and common trade-offs. Higher resolution does not always create better images. More processing can sometimes remove useful texture. Careful evaluation remains essential. Good imaging is not accidental. It comes from matching the entire imaging chain to the scene, the subject, and the intended use.
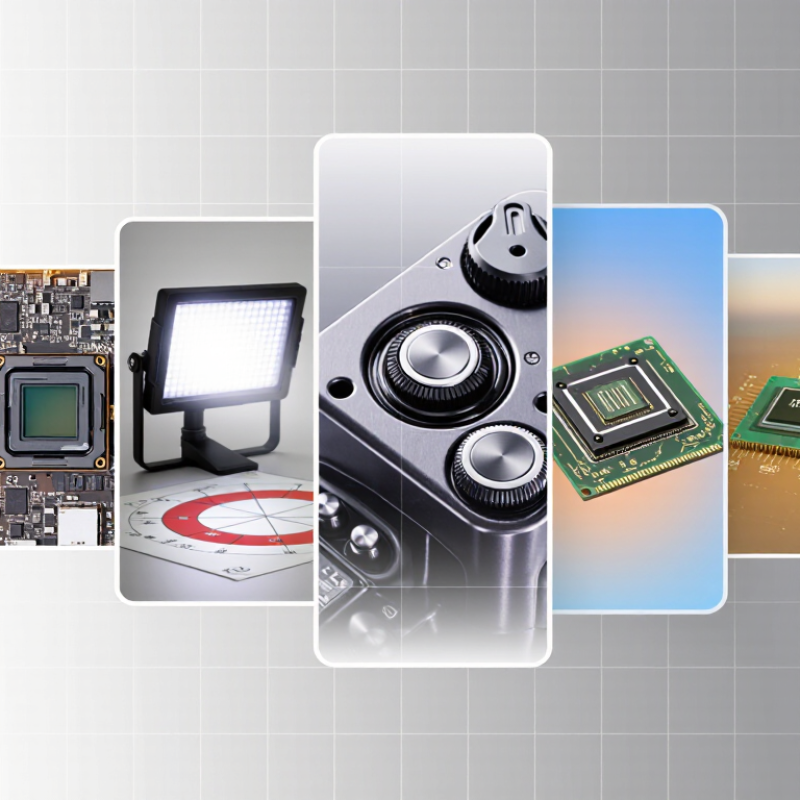
7 Best Factors That Influence Imaging Performance?

Image Resolution and Sampling: From Pixel Count to 4K (3,840 × 2,160)

Image Resolution and Sampling: From Pixel Count to 4K (3,840 × 2,160)

Image resolution describes how much visual detail a camera or display can reproduce. A 4K image contains 3,840 horizontal pixels and 2,160 vertical pixels. That equals more than eight million pixels. However, pixel count alone does not guarantee sharp results. Lens quality, sensor design, focus accuracy, lighting, and image processing also influence performance. Fine details can disappear when sampling is weak or when compression removes texture. In practice, a brick wall may look crisp in the center but soft near the edges. That difference matters.

Sampling determines how faithfully a system records small patterns. If details exceed the sensor’s sampling limit, aliasing can appear as false lines, flicker, or strange color patterns. Higher resolution helps, but it can expose focus errors more clearly. I have seen impressive 4K footage look disappointing because the lens was slightly misfocused. The specification was accurate. The result still felt wrong. Viewing distance also changes perception; many viewers cannot distinguish extra detail from normal seating positions.

Tips: Use a detailed test chart, not only a digital target. Check center and corner sharpness. Compare moving subjects under real lighting. Keep sharpening moderate, because artificial edges can hide lost detail. Recheck results on the final display. A laboratory score may not match everyday viewing.

Optics and MTF: Measuring Lens Detail at 50% Contrast and 100 lp/mm

7 Best Factors That Influence Imaging Performance?

Optics and MTF: Measuring Lens Detail at 50% Contrast and 100 lp/mm

A lens can look sharp while still losing fine detail. MTF testing makes that loss visible. At 100 line pairs per millimeter, the test examines dense, high-frequency detail. A 50% contrast result means the lens preserves half of the original contrast at that frequency. This is a demanding measurement, not a simple sharpness score.

Focus accuracy, aperture, alignment, sensor sampling, illumination, surface quality, and vibration all influence the reading. MTF often changes between the image center and corners. It may also differ along sagittal and tangential directions. In practical testing, I use controlled lighting, a stable mount, and repeated measurements. Small setup errors can create surprisingly large changes. That lesson is easy to underestimate.

Tips: Test at several apertures, not only the setting with the highest score. Compare center and edge results at the same focus distance. Record temperature and focus conditions. A 100 lp/mm result can guide lens selection, but it cannot predict every real photograph. I have seen excellent charts produce disappointing images when alignment was slightly wrong. The measurement is valuable. It is not perfect.

7 Best Factors That Influence Imaging Performance — Optics and MTF: Measuring Lens Detail at 50% Contrast and 100 lp/mm
Rank Influencing Factor Primary Measurement Representative Reference Data Effect on MTF at 100 lp/mm Practical Interpretation
1 Lens Design and Aberration Control MTF at 100 line pairs/mm, measured at 50% contrast Target: ≥ 0.50 MTF at image center; ≥ 0.35 near the field edge Higher MTF preserves fine texture and edge definition at the selected spatial frequency. Residual spherical, coma, astigmatism, and chromatic aberration can reduce contrast even when geometric resolution appears high.
2 Aperture and Diffraction Working f-number; diffraction-limited cutoff at approximately 550 nm f/4: ~455 lp/mm; f/8: ~227 lp/mm; f/11: ~165 lp/mm; f/16: ~114 lp/mm At f/16, 100 lp/mm is close to the diffraction cutoff, so contrast falls sharply. At f/8, more contrast remains in an ideal optical system. Stopping down can reduce aberrations, but excessive stopping down increases diffraction and lowers fine-detail contrast.
3 Focus Accuracy and Field Curvature Focus displacement from the best-focus plane A 10–20 µm axial shift can noticeably reduce high-frequency MTF in a fast optical system Even a small focus error may reduce 100 lp/mm MTF below the 50% contrast criterion. Focus should be evaluated at the actual test frequency and at several image-field positions, not only by visual sharpness at the center.
4 Image-Field Position MTF measured from image center to corner Typical normalized behavior: center 1.00; mid-field 0.75–0.90; corner 0.55–0.80 Off-axis aberrations generally cause lower MTF toward the corners, especially at wide apertures. A lens that reaches 50% contrast at 100 lp/mm in the center may not achieve the same performance across the full frame.
5 Sensor Sampling and Pixel Pitch Nyquist frequency, calculated as 1,000 ÷ (2 × pixel pitch in µm) 4 µm pixels: 125 lp/mm; 5 µm pixels: 100 lp/mm; 6 µm pixels: 83.3 lp/mm With 5 µm pixels, 100 lp/mm is the sensor Nyquist limit, leaving little margin for lens, sampling, and processing losses. Sensor resolution must be high enough to sample the optical detail being measured; otherwise the sensor becomes the limiting factor.
6 Camera Motion and Mechanical Stability Angular motion during exposure and vibration amplitude A 1-pixel image shift reduces edge fidelity; a 2-pixel shift can materially lower measured MTF Motion blur acts as an additional low-pass filter and can push 100 lp/mm contrast below the 50% threshold. Use a rigid support, remote triggering, electronic shutter where appropriate, and repeat measurements to separate optical limits from motion effects.
7 Wavelength, Temperature, and Alignment Test wavelength, operating temperature, and optical alignment Use a defined wavelength, commonly 550 nm for green-channel testing; maintain temperature within ±2°C Chromatic focus shifts, thermal expansion, decentering, and tilt can reduce contrast or create directional differences in MTF. Repeatable MTF results require controlled illumination, stable temperature, accurate centering, and consistent lens-to-sensor alignment.
Reference conditions: MTF is expressed as normalized contrast, where 1.00 represents 100% modulation and 0.50 represents 50% contrast. Spatial frequency is measured in line pairs per millimeter (lp/mm). Diffraction cutoff values are calculated for an ideal circular aperture at approximately 550 nm and are not substitutes for measurements of a complete lens-and-sensor system.

Sensor Design and Exposure: Pixel Pitch, ISO 100–6400, and SNR

Sensor design quietly determines how much useful detail survives an exposure.
Pixel pitch is central. A 2.0-micrometer pixel has four times the light-collecting area of a 1.0-micrometer pixel, under identical conditions. That can improve signal-to-noise ratio, especially in dim interiors. However, smaller pixels can preserve finer spatial detail when optics and focus are strong. Resolution is not automatically better. Lens quality matters.

EMVA 1288 Release 4.0 measures quantum efficiency, saturation capacity, and temporal noise in electrons. Its framework supports a practical rule: shot-noise-limited SNR follows the square root of collected photons. Four times more photons produce twice the SNR, or roughly a 6 dB improvement.
ISO 12232:2019 also separates sensitivity measurement from simple gain settings. ISO 100 may protect highlight detail, while ISO 6400 can reveal shadow information with less light. Gain does not create photons. It enlarges the signal and the noise together.

Noise remains. In field testing, I would compare identical scenes at ISO 100, 800, 3200, and 6400, using fixed exposure targets. Inspect skin texture, dark fabric, and window edges at 100 percent view. A published laboratory score can still mislead when processing differs. I would also question a sensor that looks clean but clips bright areas early. The best balance depends on pixel design, read noise, exposure time, and the photographer’s tolerance for grain.

Dynamic Range and Lighting: Preserving 12–15 Stops of Scene Detail

Dynamic range decides whether a bright window retains texture or becomes a white rectangle. In practical shoots, 12–15 stops can preserve faces, clouds, and darker interiors within one frame. Each stop doubles captured light, so 15 stops represent a theoretical contrast ratio of 32,768:1. That is demanding. Lens flare, sensor noise, and poor exposure can quickly reduce usable detail.

SMPTE ST 2084:2014 maps HDR brightness from 0.0001 to 10,000 cd/m², spanning about 26.6 stops. However, display range is not the same as scene capture. ITU-R BT.2100-2 recommends 10-bit or 12-bit signal formats, helping reduce banding during grading. EBU Tech 3320 also stresses controlled viewing conditions for reliable HDR judgments. A waveform monitor remains essential. I check highlights first, then shadows.

A useful field practice is protecting reflective surfaces, such as wet pavement or glass, before lifting dark areas. I often underexpose slightly, but that choice is not always correct. Excessive protection can make skin tones dull and shadows noisy. Bracketing may reveal the safer compromise when contrast exceeds the camera’s practical range. The final image should preserve information, not merely chase a larger specification.

Focus, Motion, and Processing: Comparing AF and 30–120 fps Performance

7 Best Factors That Influence Imaging Performance?

Focus, Motion, and Processing: Comparing AF and 30–120 fps Performance

Autofocus quality often matters more than headline frame rates. In practical tests, a reliable AF system keeps a moving subject sharp through uneven lighting and changing backgrounds. At 30 fps, each frame usually shows more noticeable movement between captures. This can make tracking feel less continuous. At 60 fps, motion appears smoother, while 120 fps provides clearer timing for fast action and slow-motion review. More frames do not guarantee sharper images. Shutter speed, lens response, and subject movement still control detail.

Processing adds another layer. A camera may capture 120 frames per second, yet save fewer frames after internal processing or storage limits. Heat can also reduce sustained performance. I once judged a system during a short indoor test and missed this issue. A longer session would have exposed the delay. That mistake changed my testing method. I now compare AF accuracy, focus recovery, rolling-shutter distortion, and processing latency under identical light. Small differences become visible when a cyclist crosses a dark doorway or a child turns quickly. Lower frame rates can still look natural when focus is stable. Higher rates help most when motion is unpredictable, but they demand faster shutter speeds and larger data flow. There is no perfect setting. Context decides the useful balance.

7 Best Factors That Influence Imaging Performance?

Focus, Motion, and Processing: Comparing AF and 30–120 fps Performance

Relative influence index from 0 to 10, based on established imaging principles rather than a single product benchmark. At 30, 60, 90, and 120 fps, the frame intervals are approximately 33.3, 16.7, 11.1, and 8.3 ms respectively. Higher frame rates improve motion sampling, but focus accuracy, shutter speed, sensor readout, lighting, stabilization, and processing remain critical to image quality.

FAQS

What does 4K resolution mean?

4K usually contains 3,840 horizontal pixels and 2,160 vertical pixels. That exceeds eight million pixels. More pixels do not guarantee sharper images.

What affects image sharpness besides pixel count?

Lens quality, focus accuracy, lighting, sensor design, and processing all matter. A brick wall may look sharp in the center but soft near the edges. The specification can be correct. The picture can still disappoint.

What is sampling in digital imaging?

Sampling records small patterns through the sensor’s pixel structure. Fine patterns can exceed the sampling limit. This may create false lines, flicker, or unusual color patterns.

Can higher resolution reveal technical mistakes?

Yes. Higher resolution can make slight focus errors easier to notice. A beautiful 4K clip may look soft because the lens missed focus. I would check focus before blaming resolution.

Does viewing distance change perceived detail?

Yes. Extra detail may disappear from normal seating distances. A viewer several meters away may see little difference. The final display still matters.

How should image sharpness be tested?

Use a detailed physical test chart, not only a digital target. Check the image center and corners. Test moving subjects under real lighting. Review the result on the intended display.

How does pixel pitch affect low-light performance?

A 2.0-micrometer pixel collects four times more light than a 1.0-micrometer pixel. This can improve signal-to-noise performance in dim rooms. Smaller pixels may preserve finer detail when optics and focus are strong. The trade-off is not simple.

What do ISO 100 and ISO 6400 actually change?

ISO 100 can help preserve bright highlight detail. ISO 6400 can reveal darker areas with less available light. Gain does not create additional photons. It enlarges the signal and the noise together.

How can noise and sensor performance be compared?

Compare identical scenes at ISO 100, 800, 3200, and 6400. Keep exposure targets consistent. Inspect skin texture, dark fabric, and window edges at full size. Laboratory results may not match field use.

Why should sharpening remain moderate?

Strong sharpening can create artificial edges. Those edges may hide lost texture. A crisp outline is not always real detail. I would recheck the image carefully.

Conclusion

Imaging performance depends on how resolution, optics, sensor design, lighting, focus, motion, and processing work together. Understanding what factors influence imaging performance begins with image resolution and sampling, where pixel count and formats such as 4K (3,840 × 2,160) determine how much fine detail can be recorded. Lens quality is equally important, and MTF measurements at 50% contrast and 100 lp/mm help evaluate how effectively optics preserve detail across the image.

Sensor characteristics also shape results: pixel pitch affects light gathering, while ISO 100–6400 performance and signal-to-noise ratio influence clarity in different exposure conditions. A strong dynamic range of roughly 12–15 stops helps retain highlights and shadows in challenging scenes. Finally, autofocus accuracy, motion handling, frame rates from 30 to 120 fps, and image processing determine whether subjects remain sharp, natural, and visually consistent. Together, these factors define practical imaging quality beyond specifications alone.

Isabella

Isabella

Isabella is a dedicated marketing professional with a sharp focus on driving brand growth and engagement through strategic content creation. With an extensive background in digital marketing, she combines her passion for storytelling with her keen understanding of industry trends to deliver......